Scratch advent calendar projects

Here’s a Christmas-themed Scratch project that I am going to do with my Year 7s. We’re going to make advent calendars. It can be differentiated several ways:

First project is a simple calendar where you click on a numbered door to change its costume and reveal a surprise – there are loads of Christmassy pictures in the ‘holiday’ category on Scratch. Pupils can make their own from, ahem, scratch or use a supplied framework. They can shuffle the doors up, add sounds, animation, change the background – whatever they want.

The second project is a bit cleverer. This uses the ‘days since 2000′ block to work out when each day has happened and opens the door automatically. You could get your class to work out the numbers for this themselves, or give them a hint – either the number for 1st Dec (I think it’s 6179 days for 1st Dec 2016) or get them to print today’s day number and work it out from there.

Posted in Uncategorized | Tagged , | 2 Comments

Updated SenseHAT weather station

Still pondering how best to improve my simple Raspberry Pi SenseHAT weather station, but I thought I’d share some improvements.

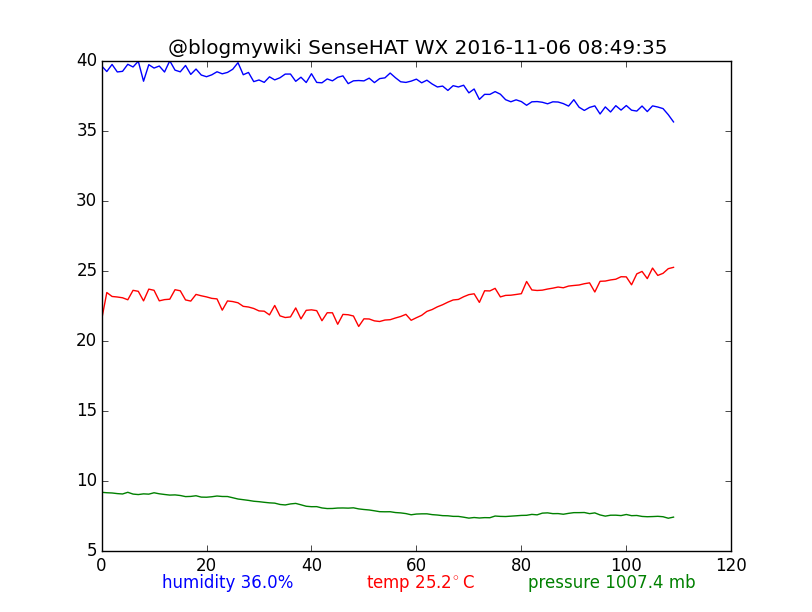
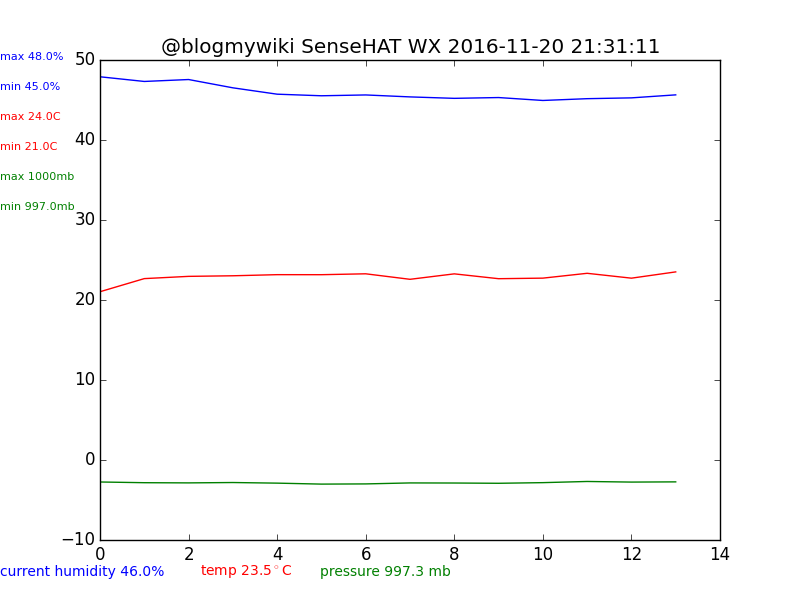
The code now keeps track of highs and lows over the period it’s been logging and displays them on the chart along with the current readings for temperature, humidity and air pressure.

This FTPs the chart and data in a CSV file to a remote web server for display on a web page and it’s also designed to run headless at startup, so it doesn’t need a windowed environment running to plot the graph. It will also show on the SenseHAT display when it’s uploading a file and if there’s been an FTP problem.

The downside of this is, of course, the code is much longer…

#!/usr/bin/python

# v5 runs headless, info on LEDs, FTPs CSV file & only charts last 24 hrs
# v4 FTPs chart to remote web server
# v3 adds real timestamping and logging to a CSV file
import matplotlib
matplotlib.use('Agg')   # used as running headless without windows
import matplotlib.pyplot as plt
from time import sleep
from sense_hat import SenseHat
import time
from datetime import datetime
import os
import ftplib

def getCPUtemperature():
 res = os.popen('vcgencmd measure_temp').readline()
 return(res.replace("temp=","").replace("'C\n",""))

sense = SenseHat()

interval_min = 5 # measurement interval in minutes
hrs_shown = 24  # number of hours covered by chart
chart_span = int(hrs_shown*(60/interval_min)) # calculate number of readings to show

# uncomment these lines to write headers to CSV file
#fd = open('logging.csv','a')
#fd.write('time,pressure,temperature,humidity\n')
#fd.close()

while True:
    pressure_list = []
    temp_list = []
    humidity_list = []
    x = []
    a = 0
    daily_max_humidity = 0
    daily_max_temp = 0
    daily_max_pressure = 0
    daily_min_humidity = 2000
    daily_min_temp = 2000
    daily_min_pressure = 2000

    for a in range (chart_span):
        sense.clear()
        fd = open('/home/pi/Desktop/logging.csv','a')
        pressure = sense.get_pressure()-1000
        pressure_list.append(pressure)
    # attempt to calculate ambient temperature
    # based on dgaust in https://www.raspberrypi.org/forums/viewtopic.php?f=104&t=111457
        cpuTemp=int(float(getCPUtemperature()))
        ambient = sense.get_temperature_from_pressure()
        calctemp = ambient - ((cpuTemp - ambient)/ 1.5)
        temp_list.append(calctemp)

        humidity = sense.get_humidity()
        humidity_list.append(humidity)

        timestamp = str(datetime.now().strftime('%Y-%m-%d %H:%M:%S'))
        fd.write(timestamp+','+str(pressure)+','+str(calctemp)+','+str(humidity)+'\n')
        fd.close()
#        print(timestamp, pressure, calctemp, humidity)

        x.append(a)
        a = a + 1

        if humidity > daily_max_humidity:
            daily_max_humidity = humidity
        if calctemp > daily_max_temp:
            daily_max_temp = calctemp
        if pressure > daily_max_pressure:
            daily_max_pressure = pressure
        if humidity < daily_min_humidity:
            daily_min_humidity = humidity
        if calctemp < daily_min_temp:
            daily_min_temp = calctemp
        if pressure < daily_min_pressure:
            daily_min_pressure = pressure

        print('max humidity '+str(daily_max_humidity))
        print('max temp '+str(daily_max_temp))
        print('max pressure '+str(daily_max_pressure))
        print('min humidity '+str(daily_min_humidity))
        print('min temp '+str(daily_min_temp))
        print('min pressure '+str(daily_min_pressure))

        fig = plt.figure()
        plt.plot(x,humidity_list)
        plt.plot(x,temp_list,'r')
        plt.plot(x,pressure_list,'g')
        plt.title('@blogmywiki SenseHAT WX '+timestamp)
        plt.figtext(0, 0.9, "max "+str(round(daily_max_humidity,0))+"%",color='blue',fontsize=8)
        plt.figtext(0, 0.85, "min "+str(round(daily_min_humidity,0))+"%",color='blue',fontsize=8)
        plt.figtext(0, 0.8, "max "+str(round(daily_max_temp,0))+"C",color='red',fontsize=8)
        plt.figtext(0, 0.75, "min "+str(round(daily_min_temp,0))+"C",color='red',fontsize=8)
        plt.figtext(0, 0.7, "max "+str(round(daily_max_pressure,0)+1000)+"mb",color='green',fontsize=8)
        plt.figtext(0, 0.65, "min "+str(round(daily_min_pressure,0)+1000)+"mb",color='green',fontsize=8)
        plt.figtext(0, 0.04, "current humidity "+str(round(humidity,0))+"%",color='blue',fontsize=10)
        plt.figtext(0.25, 0.04, "temp "+str(round(calctemp,1))+"$^\circ$C",color='red',fontsize=10)
        plt.figtext(0.4, 0.04, "pressure "+str(round(pressure,1)+1000)+" mb",color='green',fontsize=10)
        fig.savefig('/home/pi/Desktop/wx_chart6.png')
        sense.show_message("Updating", text_colour=[0,80,0])

        try:
            session = ftplib.FTP('FTP-SERVER-ADDRESS','FTP-USERNAME','FTP-PASSWORD')
            file = open('/home/pi/Desktop/wx_chart6.png','rb')          # open chart file
            session.storbinary('STOR /SERVER_PATH/wx_chart.png', file)  # send the file
            file.close()                                                # close file
            file = open('/home/pi/Desktop/logging.csv','rb')            # open csv file
            session.storbinary('STOR /SERVER_PATH/logging.csv', file)   # send the file
            file.close()
            session.quit()
            sense.show_letter(".",text_colour=[0, 80, 0])   # green dot to show it's running & FTP'd ok
        except ftplib.all_errors as e:
            print(e)
            sense.show_message("FTP error", text_colour=[80,0,0])
            sense.show_letter(".",text_colour=[80, 0, 0])  # red dot to show it's running but not FTP'd
        sleep(interval_min*60)
Posted in Raspbian | Tagged , | 2 Comments

Simple Raspberry Pi weather station


Chart showing the weather in my lounge overnight! Can you spot when the central heating came on? Also note the correlation between temperature and humidity. Numbers refer to blocks of 5 minutes.

I previously blogged about some very simple Python you can use to do to live data logging and graphing of environmental factors like air pressure, humidity and (sort of) temperature using the Raspberry Pi computer and a SenseHAT module.

Well, the project’s evolved a bit over the last day or so and this 4th iteration is becoming more like a weather station. I know this is not an original idea, but I wanted to have a go at writing all the code myself as I want to build a weather station in my school and this would be a good ‘proof of concept’ project. Ideally I’d like the pupils to design as much as possible, this could be used to show them the kinds of things you can do with snap-together parts and relatively few lines of code.

This version still draws a live(ish) chart on the Pi’s screen but now…

  • It logs readings to a time-stamped CSV file – this means you can analyse the data later using a spreadsheet program or similar.
  • It saves a PNG image file of the chart which it then sends by FTP – for example, to update a chart on a web site.
  • The chart displays the current readings at the bottom and timestamps the title

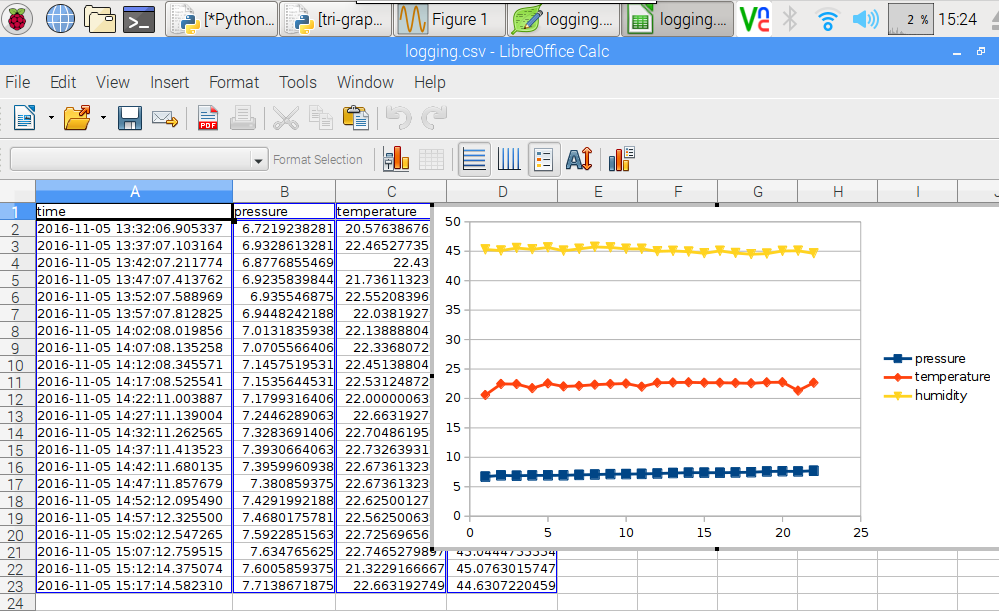
Drawing charts from the saved CSV file using a spreadsheet is easy. This is using LibreOffice on the Pi itself but you could also use Microsoft Excel or Apple Numbers.

There’s much to do with this still. It keeps drawing the graph over bigger and bigger timescales, and I I guess it will eventually run out of memory as the list gets too long, so I need to sort that out. And it would be nice to also FTP the CSV file, include some daily high/low information, have proper time stamps on the chart, make use of the SenseHAT’s LED display/buttons in some way and make it run headless.

I also need to do some tests to see how accurate the temperature fudge might be – perhaps I should also log the SenseHAT’s temperature data as well as the estimated ambient temperature?

Here’s the code. It needs to run in Python 3, a connected SenseHAT and the matplotlib Python library installing.

# v4 FTPs chart to remote web server
# v3 this adds real timestamping and logging to a CSV file
import matplotlib.pyplot as plt
from time import sleep
from sense_hat import SenseHat
import time
from datetime import datetime
import os

import ftplib

def getCPUtemperature():
 res = os.popen('vcgencmd measure_temp').readline()
 return(res.replace("temp=","").replace("'C\n",""))

sense = SenseHat()
plt.ion()
pressure_list = []
temp_list = []
humidity_list = []
x = []
a = 0
# uncomment these lines to write headers to CSV file
#fd = open('logging.csv','a')
#fd.write('time,pressure,temperature,humidity\n')
#fd.close()

while True:
    fd = open('logging.csv','a')
    pressure = sense.get_pressure()-1000
    pressure_list.append(pressure)
# attempt to calculate ambient temperature
# based on dgaust in https://www.raspberrypi.org/forums/viewtopic.php?f=104&t=111457
    cpuTemp=int(float(getCPUtemperature()))
    ambient = sense.get_temperature_from_pressure()
    calctemp = ambient - ((cpuTemp - ambient)/ 1.5)
    temp_list.append(calctemp)

    humidity = sense.get_humidity()
    humidity_list.append(humidity)

    timestamp = str(datetime.now().strftime('%Y-%m-%d %H:%M:%S'))
    fd.write(timestamp+','+str(pressure)+','+str(calctemp)+','+str(humidity)+'\n')
    fd.close()
    print(timestamp, pressure, calctemp, humidity)

    x.append(a)
    a = a + 1

    plt.clf()
    plt.plot(x,humidity_list)
    plt.plot(x,temp_list,'r')
    plt.plot(x,pressure_list,'g')
    plt.title('@blogmywiki SenseHAT WX '+timestamp)
    plt.figtext(0.2, 0.04, "humidity "+str(round(humidity,0))+"%",color='blue')
    plt.figtext(0.45, 0.04, "temp "+str(round(calctemp,1))+"$^\circ$C",color='red')
    plt.figtext(0.65, 0.04, "pressure "+str(round(pressure,1)+1000)+" mb",color='green')
    plt.savefig('wx_chart.png')
    plt.draw()

    try:
        session = ftplib.FTP('FTP-ADDRESS-HERE','FTP-USERNAME','FTP-PASSWORD')
        file = open('/home/pi/Desktop/wx_chart.png','rb')           # file to send
        session.storbinary('STOR WEB-SERVER-PATH-HERE/wx_chart.png', file)     # send the file
        file.close()                                                # close file and FTP
        session.quit()
    except ftplib.all_errors as e:
        print(e)

    sleep(300)

UPDATE – I’ve got a new version here that runs headless and shows max/min data.

Posted in Raspberry Pi, Raspbian | Tagged , , | Leave a comment

RaspberryPi SenseHAT live pressure graphs

UPDATE: Now plotting air pressure, temperature AND humidity – see end of this post!

I’ve been playing with the RaspberryPi SenseHAT to see how easy it would be to code some live data logging of environmental factors like temperature or air pressure.

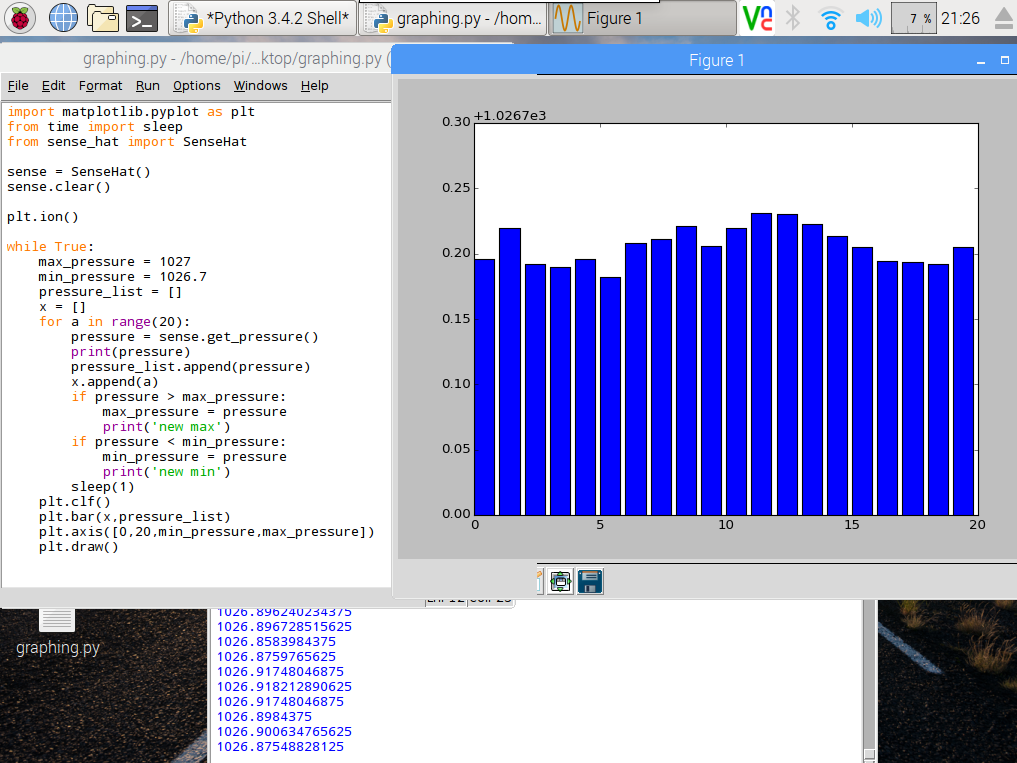
The Python matplotlib library makes it easy to plot nice graphs, and you can even update them. The Python code below takes a reading from the air pressure sensor on the SenseHAT every second for 20 seconds, and writes the readings into a list called pressure_list. It also logs the air pressure readings in the console you get a live readout which may be useful later…

It also writes numbers up 20 in a list called x to give us some numbers to go on the x-axis of our graph.

When the 20 seconds are up, it plots a bar chart of the readings, zoomed in to show only air pressures between 1026.7 and 1027 millibars – this is roughly the current range of air pressures in my lounge and the plt.axis command ensures we can easily see the differences in the bar chart. I also check to see if there are any exceptionally high or low pressure readings in each 20 second cycle, and take those into account when plotting the bar chart, though this gets reset on the next pass. You may need to fiddle with values for max_pressure and min_pressure depending on the weather!

It then repeats the process, wiping the list and starting again with 20 new air pressure readings.

Plenty still to do – the graph needs axis labels, the numbers on the Y axis are meaningless, it needs a title. You could also log the data to a CSV file, timestamp it and only display the last 20 seconds, or perhaps update a daily graph, add in temperatures and humidity too, plot line graphs, scatter charts – the possibilities are endless!

import matplotlib.pyplot as plt
from time import sleep
from sense_hat import SenseHat

sense = SenseHat()
sense.clear()     # reset the senseHAT

plt.ion()         # turn on interactive plotting

while True:
    max_pressure = 1027    # may need to tweak these numbers
    min_pressure = 1026.7  # depending on the weather!
    pressure_list = []
    x = []
    for a in range(20):
        pressure = sense.get_pressure()
        print(pressure)
        pressure_list.append(pressure)
        x.append(a)
        if pressure > max_pressure:
            max_pressure = pressure
            print('new max')
        if pressure < min_pressure:
            min_pressure = pressure
            print('new min')
        sleep(1)
    plt.clf()                      # clear the chart
    plt.bar(x,pressure_list)       # make a bar chart from the data
    plt.axis([0,20,min_pressure,max_pressure])   # zoom in the Y axis
    plt.draw()                     # make the chart appear

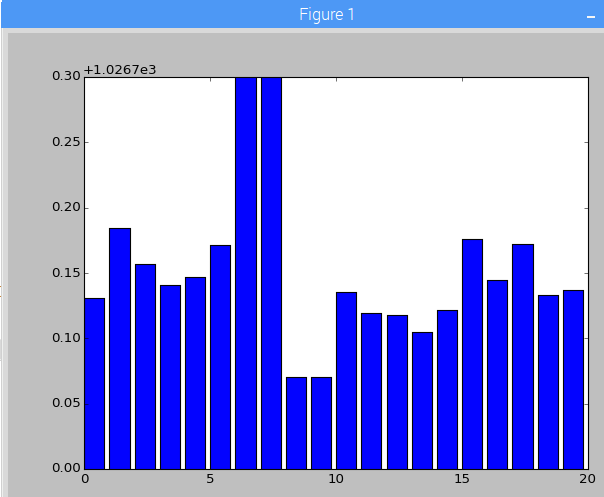
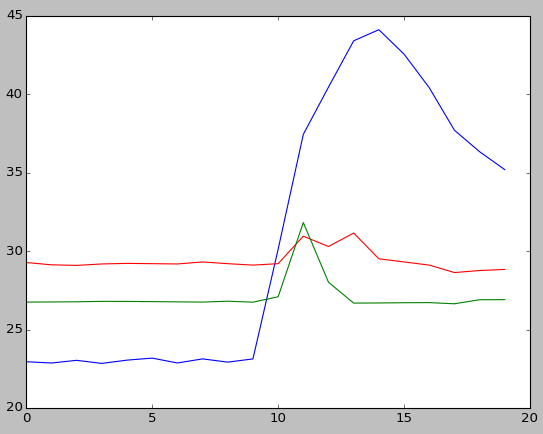
Can you see where I blew on it then inhaled deeply?


UPDATE

I've now tweaked the code and simplified it so it measures and plots humidity in blue, temperature in red and air pressure in green, still logging values every second for 20 seconds then updating the chart.

This program doesn't scale the Y axis according to maximum/minimum values but fudges things somewhat to get the scales right so you can see relatively small changes. It does this by subtracting 1000 from the air pressure reading and halving the humidity reading - this may not work in different weather conditions, but you can see the correlation between rise of temperature, humidity and air pressure when I blew hot, wet breath (ugh!) on the SenseHAT.

I have a few ideas where to take this project next, so watch this space...

import matplotlib.pyplot as plt
from time import sleep
from sense_hat import SenseHat

sense = SenseHat()

plt.ion()	# turn on interactive plotting

while True:
    pressure_list = []
    temp_list = []
    humidity_list = []
    x = []

    for a in range(20):

        pressure = sense.get_pressure()-1000
        pressure_list.append(pressure)

        temp = sense.get_temperature()
        temp_list.append(temp)

        humidity = sense.get_humidity()/2
        humidity_list.append(humidity)

        print(pressure, temp, humidity)

        x.append(a)

        sleep(1)

    plt.clf()
    plt.plot(x,humidity_list)
    plt.plot(x,temp_list,'r')
    plt.plot(x,pressure_list,'g')
    plt.draw()

Update to the Update!

Now with improved temperature readings and charts that grow and log data over much more time... no idea how long it'll run before crashing, though!

Here's the new code as featured in the video:

import matplotlib.pyplot as plt
from time import sleep
from sense_hat import SenseHat
import os

def getCPUtemperature():
 res = os.popen('vcgencmd measure_temp').readline()
 return(res.replace("temp=","").replace("'C\n",""))

sense = SenseHat()
plt.ion()
pressure_list = []
temp_list = []
humidity_list = []
x = []
a = 0

while True:
    pressure = sense.get_pressure()-1000
    pressure_list.append(pressure)
# attempt to calculate ambient temperature
# based on dgaust in https://www.raspberrypi.org/forums/viewtopic.php?f=104&t=111457
    cpuTemp=int(float(getCPUtemperature()))
    ambient = sense.get_temperature_from_pressure()
    calctemp = ambient - ((cpuTemp - ambient)/ 1.5)
    temp_list.append(calctemp)

    humidity = sense.get_humidity()
    humidity_list.append(humidity)

    print(pressure, calctemp, humidity)

    x.append(a)
    a = a + 1
    sleep(1)

    if a / 10 == int(a/10):
        plt.clf()
        plt.plot(x,humidity_list)
        plt.plot(x,temp_list,'r')
        plt.plot(x,pressure_list,'g')
        plt.draw()
Posted in Raspberry Pi | Tagged , | 5 Comments

Simple radio data communication using BBC micro:bits

The excellent Python Mu editor makes it a doddle to get micro:bits talking to each other wirelessly – check out the awesome firefly project on this page.

I thought I’d have a go myself, and in no time at all turned 3 Microbits into little glowing, wirelessly-communicating bugs.

Next I had a go at writing some code of my own, first just to send ‘A’ and ‘B’ button presses between micro:bits:

import radio
from microbit import display, button_a, button_b

radio.on()

while True:
    # Buttons send letters
    if button_a.was_pressed():
        radio.send('A')
    if button_b.was_pressed():
        radio.send('B')
    # Read incoming messages
    incoming = radio.receive()
    if incoming == 'A':
        display.show('A')
    if incoming == 'B':
        display.show('B')

Then I had a go at sending Morse code – here the A button sends dots, the B button sends dashes. There’s a bit of a delay (300 milliseconds) before the screen blanks so you can see discrete dots and dashes. Next step is to mash this up with a wired morse code project so it will automatically decode messages and display them!

import radio
from microbit import display, button_a, button_b, sleep

radio.on()

while True:
    # Buttons sends a message.
    if button_a.was_pressed():
        display.show('.')
        radio.send('.')
    if button_b.was_pressed():
        display.show('-')
        radio.send('-')
    # Read any incoming messages.
    incoming = radio.receive()
    if incoming == '.':
        display.show('.')
    if incoming == '-':
        display.show('-')
    sleep(300)
    display.show(' ')
Posted in computers, education, ICT | Tagged , , | Leave a comment