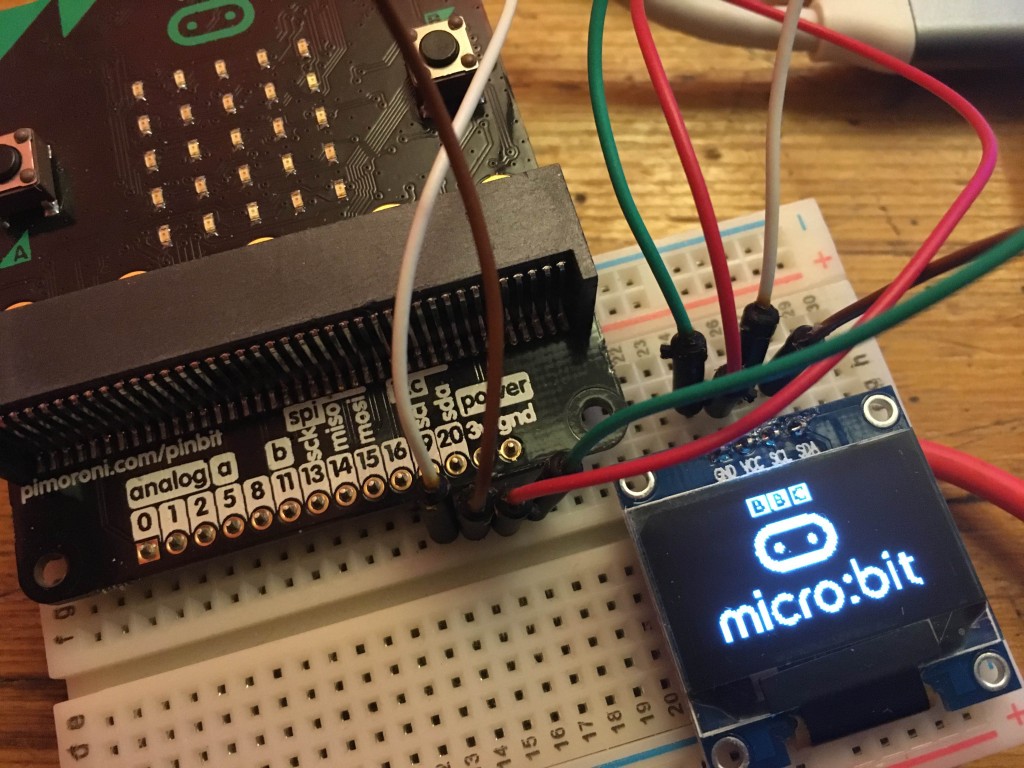
 I love add-on displays for micro:bits, and after putting a cheap colour LCD through its paces, I’ve been experimenting with a tiny 128×64 pixel OLED screen.
OLED displays are great because they are very sharp and have insanely high contrast – which is why OLED TVs are so good. Instead of blocking out a backlight with filters, like LCDs, OLEDs have a tiny LED as each pixel which either emits light or doesn’t – so black really is black.
This display cost just over £5. It’s an SSD1306, widely-used in Arduino and other hobby projects, which means drivers are available for it. Unlike the colour LCD I used last week, this has a MakeCode extension that works with the current version of MakeCode.
MakeCode
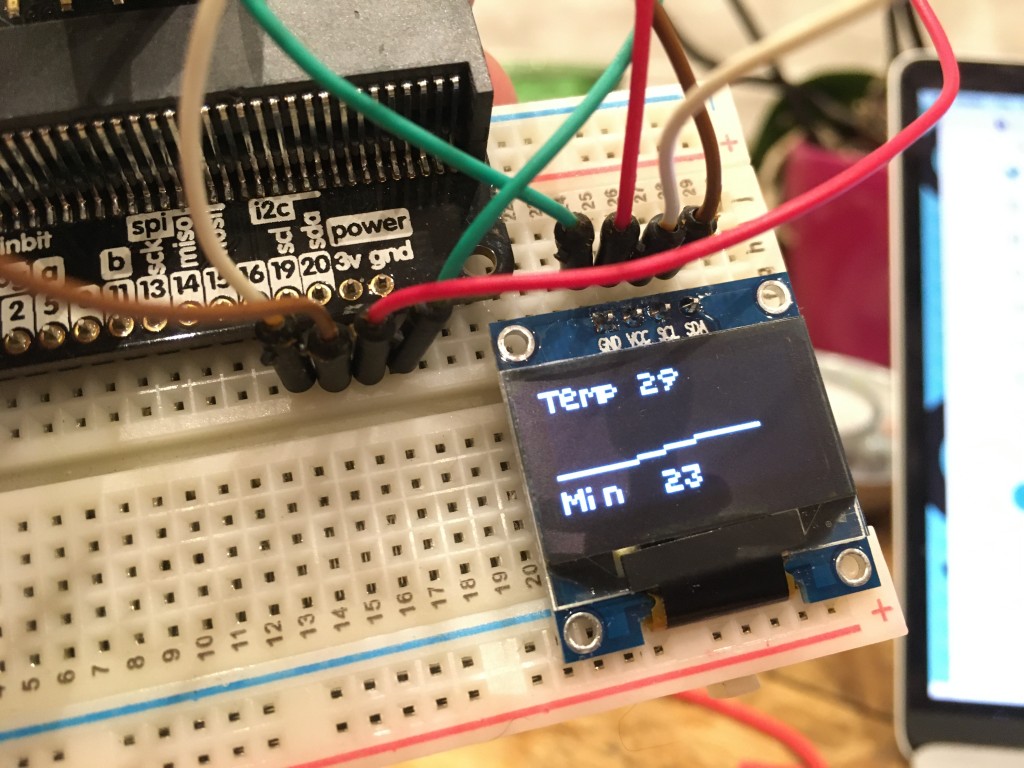
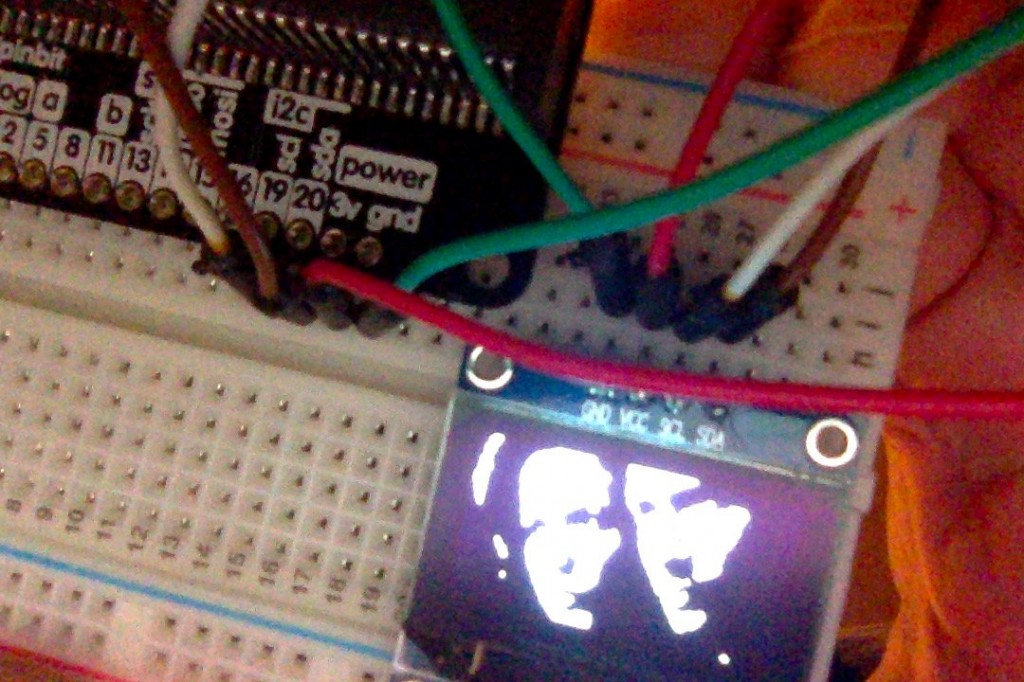
Once you add the approved MakeCode extension, you connect your display using just 4 wires: GND on he display to micro:bit GND, VCC to 3v, SCL (serial clock) to 19 and SDA (serial data) to micro:bit pin 20. These last two are the I2C pins on the micro:bit, so you’ll need a special edge-connector / breakout board to get at them. Adafruit are about to release one in the UK via PiHut, the Kitronik one requires you to solder pins to get at I2C, so I used a Pimoroni pin:bit, 4 jumper wires and a breadboard.
The MakeCode extensions are very easy to use, though in normal mode they double up the pixels, giving an effective resolution of just 64 x 32. I guess this is to make the tiny text more readable – it uses the micro:bit’s 5×5 font with no spacing, so it’s not the easiest text to read but you can still get way more information on the display than you can with a micro:bit alone. The ‘non-zoom’ mode seems to show text at 10×5 true pixels, which looks horrible, so I didn’t use it. This is a pity as being able to access every tiny pixel would be pretty neat.
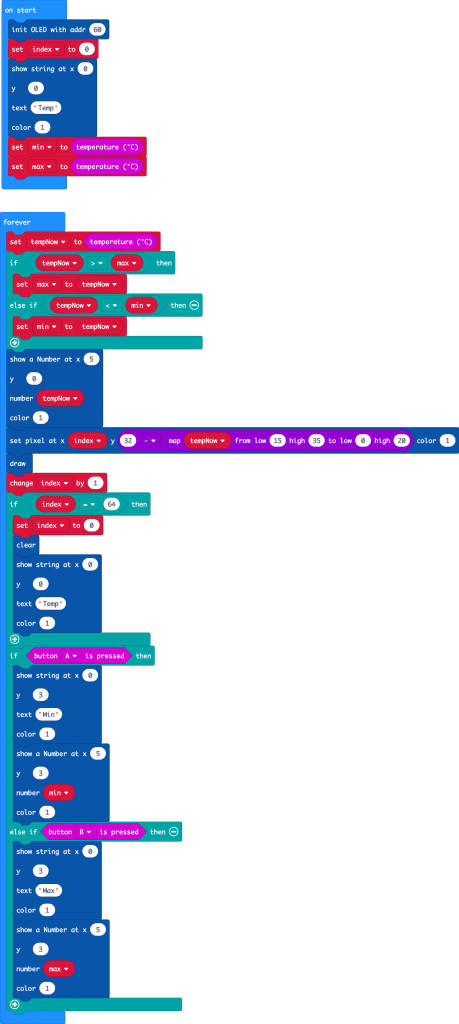
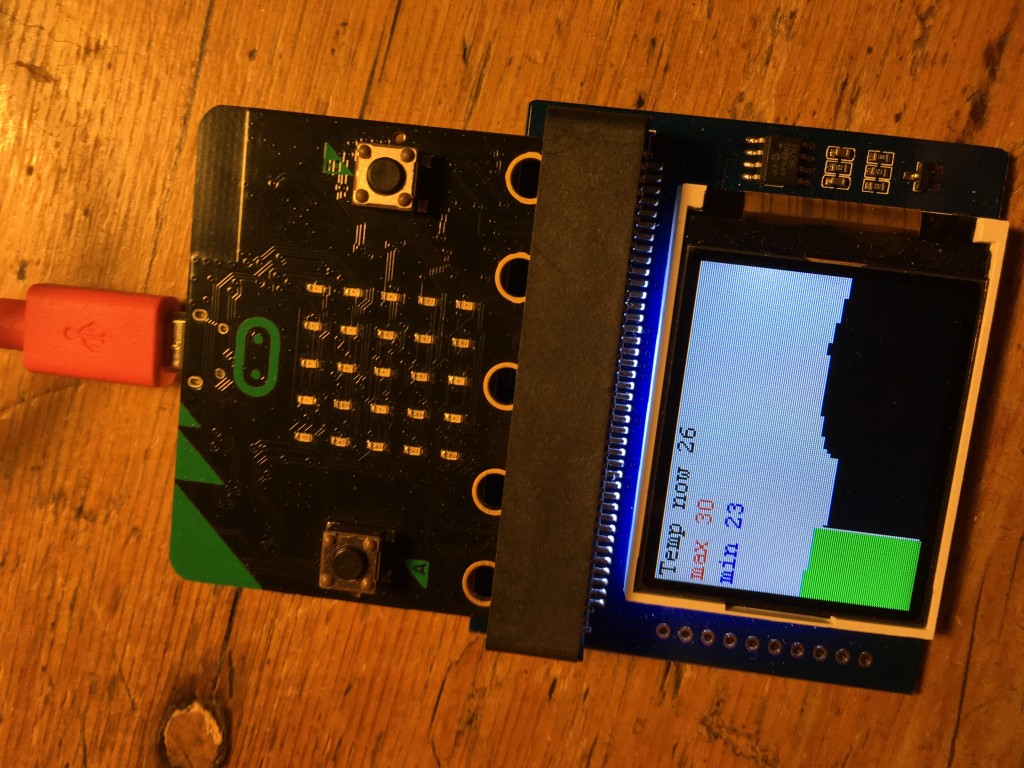
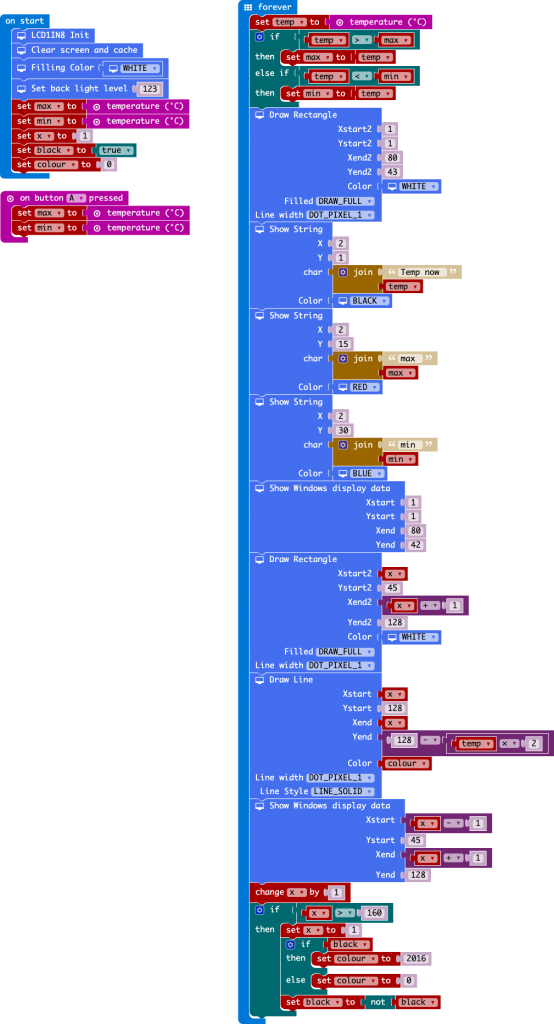
I made a max-min thermometer that plots temperature readings in real time, shows the current temperature and gives high and low readings at the press of a button.
The display seems to update faster than the colour LCD did, and when you write numbers to the display, it over-writes the whole 5×5 grid, meaning you don’t have to blank spaces by drawing rectangles as I had to do with the LCD.
There’s a block for inverting the screen as well, which you can use to make some seizure-inducing effects, and there are blocks to draw lines and rectangles (but not circles).
It was when I tried creating a game I found a major omission from this MakeCode OLED extension: there’s no way of querying the state of a given pixel. You need this to know, for example, if you’ve hit something.
There’s another MakeCode OLED extension from Elecfreaks for their Tinkercademy board and kit, which I discovered works fine without their board and just an SSD1306 OLED connected straight to the micro:bit’s i2c pins. It’s also very limited, just allowing the display of text, numbers, lines, rectangles and a progress bar that I can’t get to work, but it does use a better font, tall and narrow (around 5×7 or 5×8 pixels with spacing) but much more readable than porting the micro:bit’s own 5×5 pixel font. It seems to double each row, even when drawing graphics, so I think the effective resolution with this extension is 128×16 pixels:
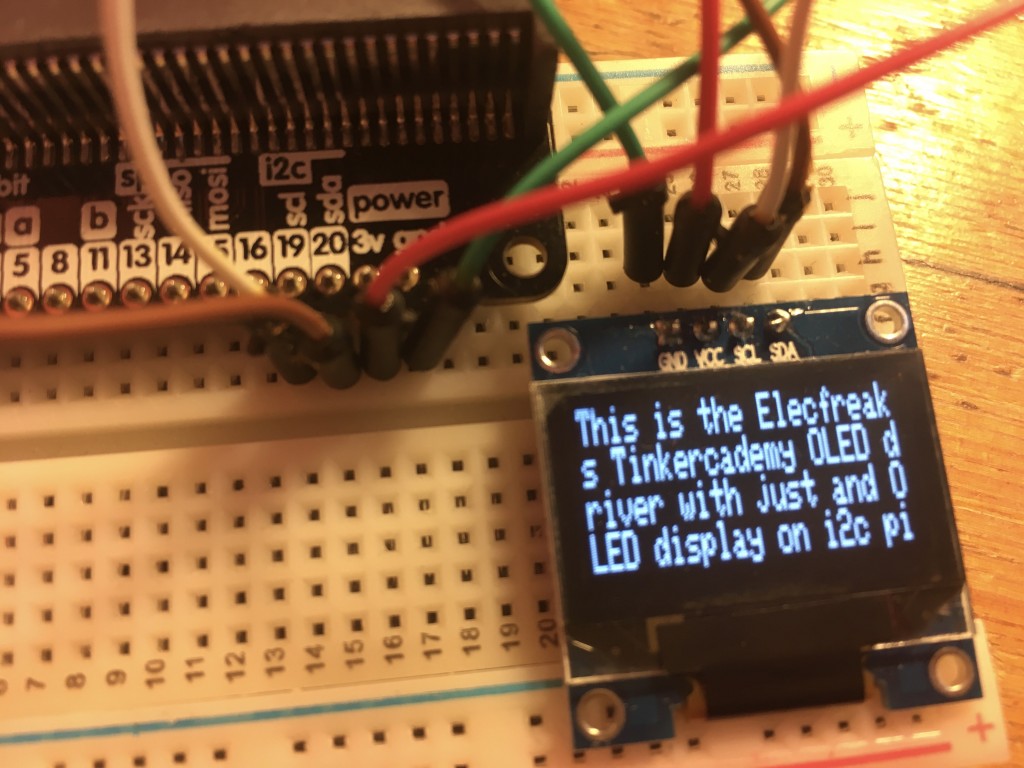
Conclusion: this MakeCode OLED driver is great for displaying information as text, numbers and simple graphics, but it’s probably not much good for graphical games.
Enter the Python
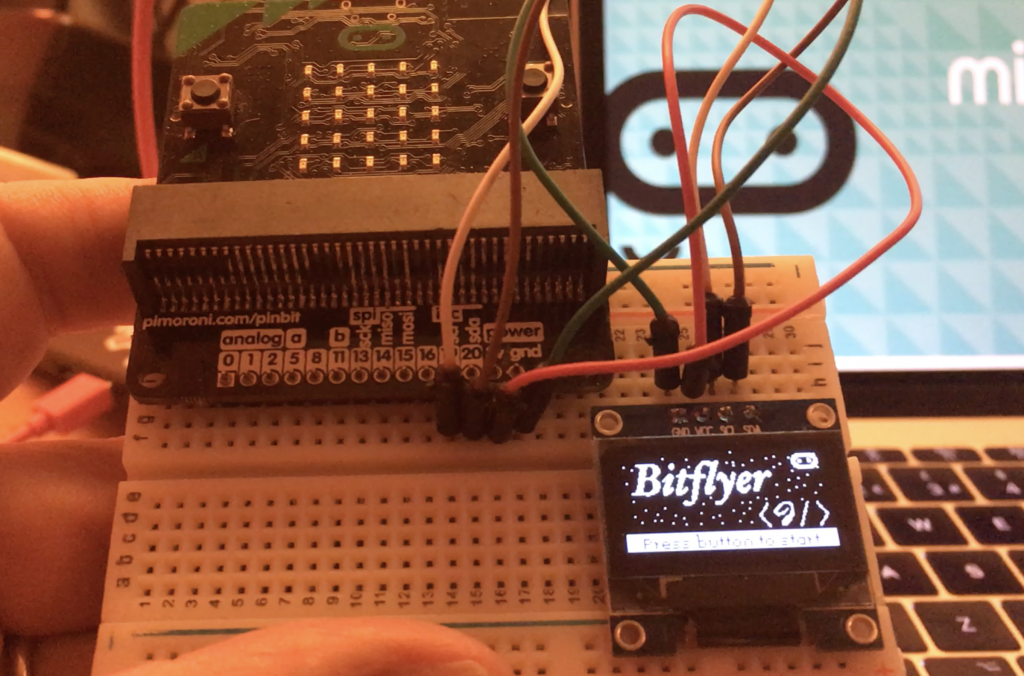
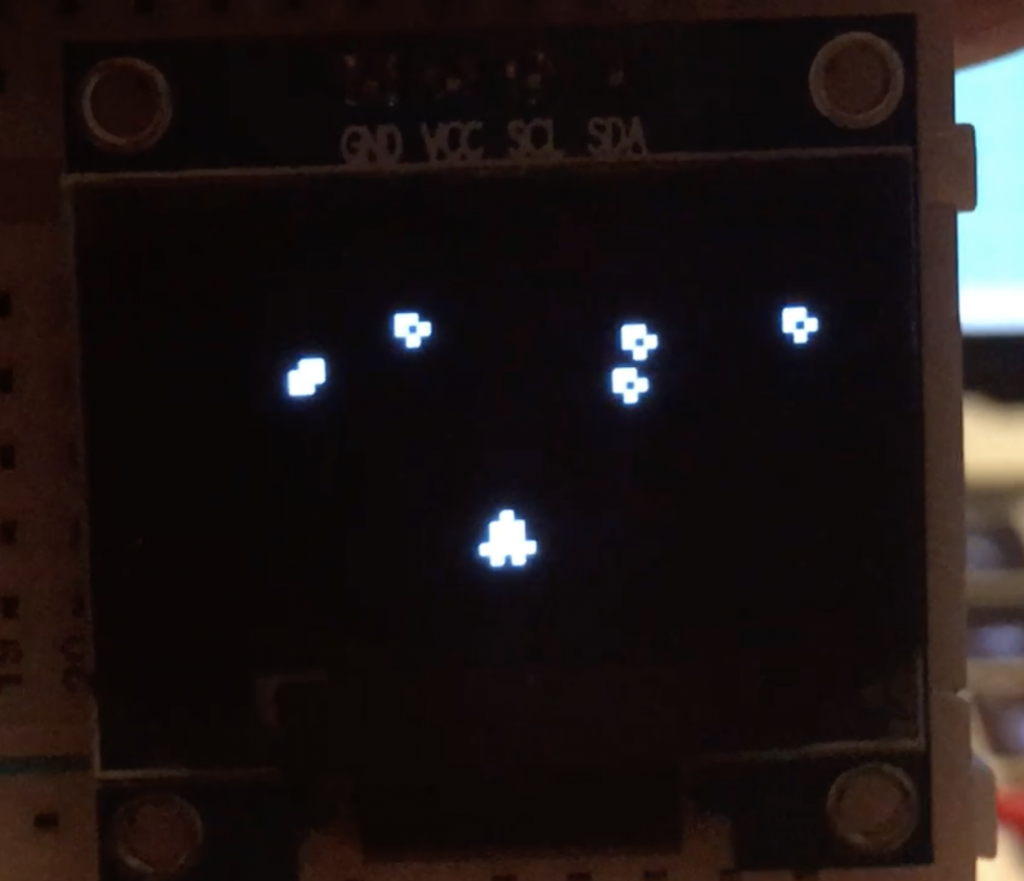
That MakeCode driver is actually based on a Python one (which is, I think, itself based on a C++ one for the Arduino). The Python library for the SSD1306 OLED display is obviously a bit trickier to use, but really much more powerful. It actually allows you to query the state of a given pixel, meaning that graphical games become feasible. Indeed, a few games are provided in the Github repo. I tried the Asteroid one and, once I’d fixed a bug, it worked!
These Python programs require you to upload multiple Python files (and bitmaps) you your micro:bit, but the good news is that this is simple using the new version of the online Python editor. Click on Load/save, then under Project Files click on ‘Show Files’ and add as many files as you need for your project, then flash to your micro:bit (direct using WebUSB if you have a recent Chrome-based browser).
I had a go at uploading my own images too – after a lot of failure, I found this the best tool for the job, but I had to invert the images so they appeared negative and use vertical draw mode. You paste the HEX numbers into the bitmap_converter.py program to generate a binary file you can upload to reference in your Python programs.
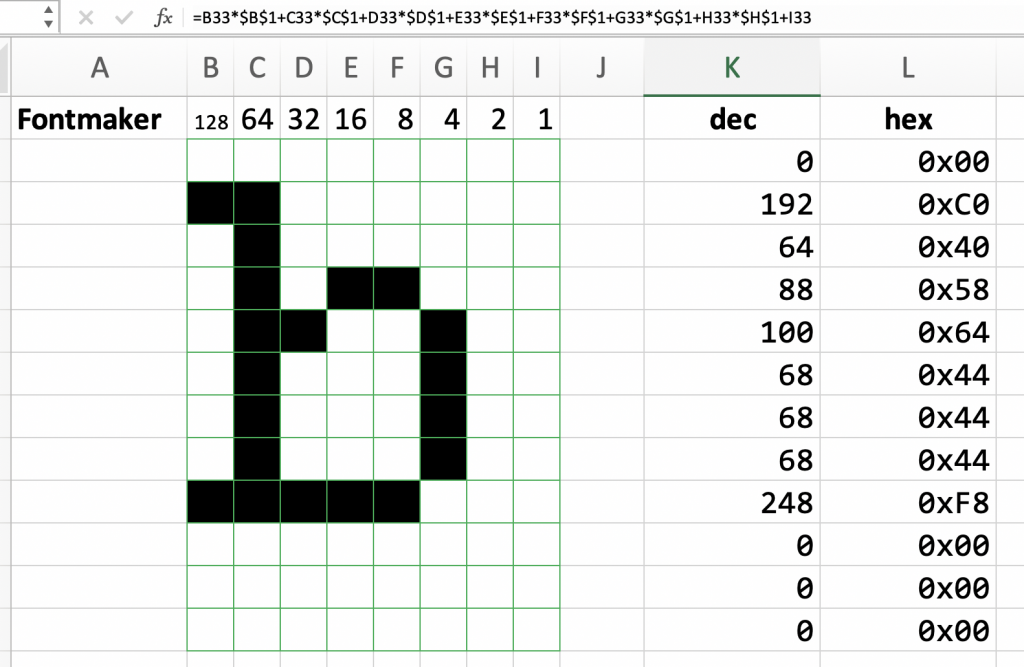
Whatever I do next with this OLED display I will probably do in Python. Improving the MakeCode extension for gaming is a bit tricky because I suspect the Python driver holds the entire image display contents in an array so it can query that. I think MakeCode would need to query the device itself and I’m not sure if that’s possible. I also had a lot of fun working out how the MakeCode driver stored the micro:bit font, and eventually worked out it was using a very weird format indeed – but I did crack it – so adding better fonts may be an option down the line.
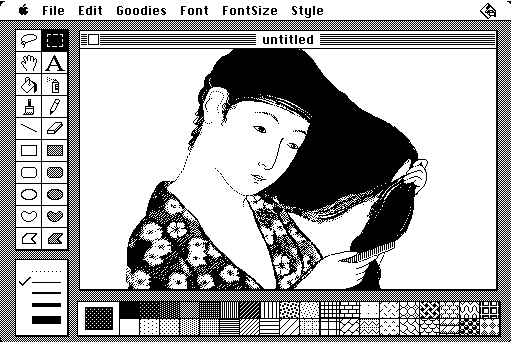
And here’s a bit of fun – what if Susan Kare had designed a micro:bit GUI in 1984 for the Macintosh?
Since writing this I’ve discovered this article which covers very similar territory, and has some nice wiring diagrams.

