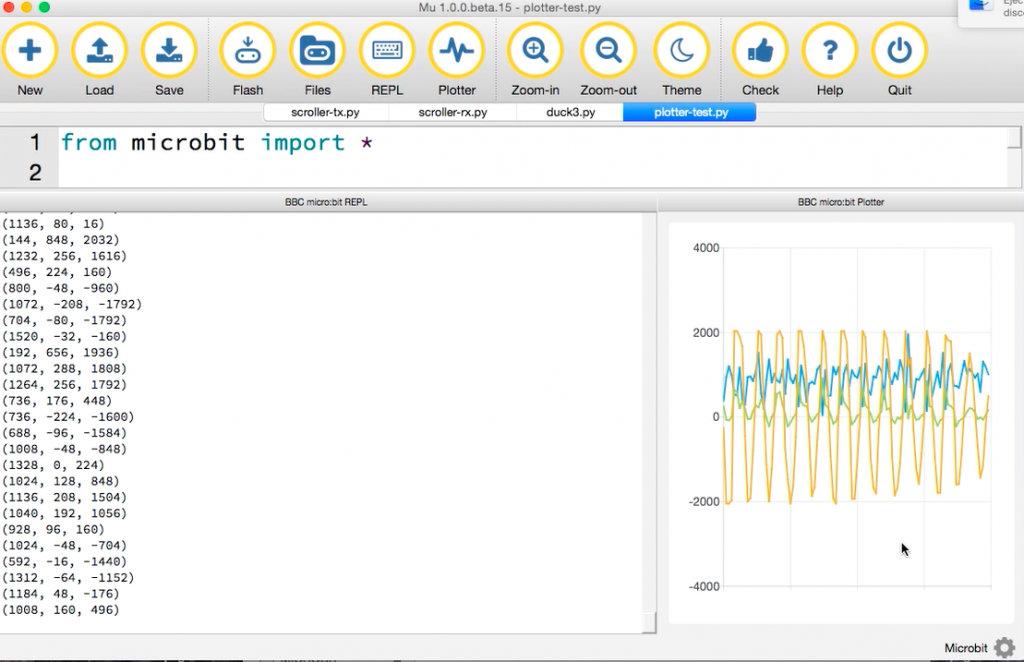
 I very much enjoyed watching the video of Nicholas Tollervey’s visit to Adafruit recently, it’s well worth a look. One of the highlights for me was a new feature (currently in beta versions of Mu 1.0) that allows live plotting of numerical data printed to the REPL (command line) by Python code on the microbit.
Apparently the live plotting idea came from Adafruit’s founder Limor Fried, and it is amazing. With just 4 lines of Python you can get live sensor reading – the accelerometer is the obvious place to start – from a microbit and display them in graph form just with a few clicks. No extra Python libraries needed, just 4 lines of code. It’s quick and easy enough to be deliverable even in a short school lesson.
I decided this would be even neater if you could untether a microbit, so here’s a project where I send accelerometer data as a string wirelessly from one microbit to another plugged into a computer running Mu. It could be great for physics experiments.
I put this code on a transmitting microbit, and attached a battery pack to it with a rubber band. You can thrown this microbit around the room, attach it to a vehicle/rocket/dog:
from microbit import *
import radio
radio.on()

while True:
    sleep(20)
    radio.send(str(accelerometer.get_values()))
I then pressed the REPL button, flashed this program to a microbit that remains tethered to the computer and clicked on the plotter button to see live accelerometer data being received from the battery-operated microbit:
from microbit import *
import radio
radio.on()

while True:
    message = radio.receive()
    sleep(20)
    print(message)
You can see a demonstration of this in my exciting YouTube video below:
You can find instructions for installing Mu on the Adafruit web site (I used the Linux ones for my old Mac as it has an old version of OS X) or you can download the latest versions of Mu from Github by following the appropriate download links at the foot of this page.
Other plotter ideas
Since tweeting about this project, Paul Knighton has been very busy. He has connected a pulse sensor to a micro:bit and is working on code to make a heart-rate monitor! He’s also connected a sound-level detector, but I love the pulse idea – so many possible cross-curricular links here:
Inspired by yourself I used a cheap https://t.co/Lwv7LSNxrV input, tweaking sampling interval until Plotter similar to own pulse (ignore the asystole at start :)). Ideal activity or demo with biofeedback/relaxation possibilities. Video: https://t.co/CjERCnbn3v pic.twitter.com/lpXtAv6UMA
— Paul Knighton (@pknighton67) March 30, 2018
Update – Nov 2020
Since I wrote this blog post a lot has changed – Microsoft MakeCode now supports data logging, have a look at this project on the Micro:bit Educational Foundation website.
And this write-up of Python data logging with Mu includes a video I made on the subject:

I’ve been trying to use the radio command to send or enable reading of data from the remote MicroBit so that it can be used in a python program on the host computer. A simple example would be pressing a button could be “reported” to the host computer, via the attached MicroBit, to be used to say operate an LED. The remote MicroBit effectively becoming a remote control. Any help please?
Just got it working! Ask if anybody else needs help.
Thanks Derek. Since I wrote this blog post, MakeCode supports data-logging with micro:bit: https://microbit.org/projects/make-it-code-it/makecode-wireless-data-logger/
…and this write-up of Python data-logging has a video also https://microbit.org/projects/make-it-code-it/makecode-wireless-data-logger/
Good luck!