Today I logged the temperature in our ICT room as part of a wider Y7 project on data handling, spreadsheets and climate change. We’re taking real historical weather data, analysing it in Excel and making Word documents about our findings.
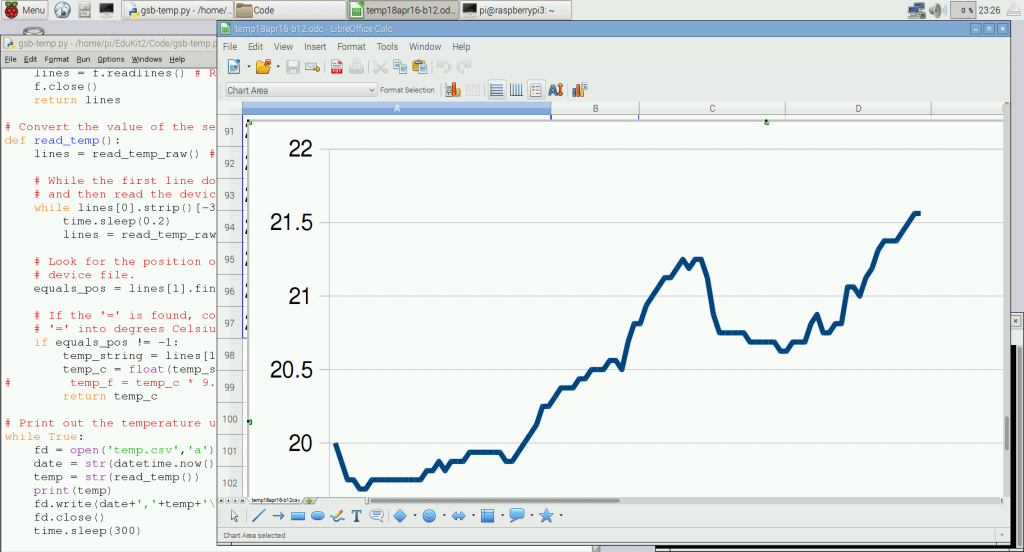
A simple Python script running on a Raspberry Pi logs the time and temperature every 5 minutes in a CSV file. I then opened the CSV file in Libre Office on the Pi and made a simple line chart.
The temperature sensor is part of the excellent CamJam Sensors EduKit thepihut.com/products/camjam-edukit-2-sensors – this costs an insane £7 for a tin box containing a breadboard, jumper wires, huge LEDs, a buzzer and light-dependent resistor.
See if you can spot:
a) when I turned the air-con on
b) when the classroom filled up with students
c) when those students turned their computers on
d) when lunch time was
e) when the afternoon classes arrived.
One problem I had was that the Raspberry Pi can’t get on the internet until AFTER it has logged in (it requires authorisation on a web page to join the school network), so to set the clock to roughly the right time & date I used the following command:
sudo date -s "Apr 20 09:30"
And here’s the Python 3 code, modified from the CamJam EduKit code. My new bit is at the end where it displays the temperature in the console but also writes the date/time and temperature to a file called temp.csv.
# CamJam EduKit 2 - Sensors
# Worksheet 3 - Temperature

# Import Libraries
import os
import glob
import time
from datetime import datetime

# Initialize the GPIO Pins
os.system('modprobe w1-gpio')  # Turns on the GPIO module
os.system('modprobe w1-therm') # Turns on the Temperature module

# Finds the correct device file that holds the temperature data
base_dir = '/sys/bus/w1/devices/'
device_folder = glob.glob(base_dir + '28*')[0]
device_file = device_folder + '/w1_slave'

# A function that reads the sensors data
def read_temp_raw():
    f = open(device_file, 'r') # Opens the temperature device file
    lines = f.readlines() # Returns the text
    f.close()
    return lines

# Convert the value of the sensor into a temperature
def read_temp():
    lines = read_temp_raw() # Read the temperature 'device file'

    # While the first line does not contain 'YES', wait for 0.2s
    # and then read the device file again.
    while lines[0].strip()[-3:] != 'YES':
        time.sleep(0.2)
        lines = read_temp_raw()

    # Look for the position of the '=' in the second line of the
    # device file.
    equals_pos = lines[1].find('t=')

    # If the '=' is found, convert the rest of the line after the
    # '=' into degrees Celsius, then degrees Fahrenheit
    if equals_pos != -1:
        temp_string = lines[1][equals_pos+2:]
        temp_c = float(temp_string) / 1000.0
#        temp_f = temp_c * 9.0 / 5.0 + 32.0
        return temp_c

# Print out and log the temperature until the program is stopped.
while True:
    fd = open('temp.csv','a')
    date = str(datetime.now())
    temp = str(read_temp())
    print(temp)
    fd.write(date+','+temp+'\n')
    fd.close()
    time.sleep(300)


next challenge is plotting the data on an online graph, any ideas?
Matplotlib and FTP an image file to a web server?